Start with callback options, simplified routing, and a quick staffing correction. Those three moves produce the fastest measurable drop in wait times, often within days rather than months. Vendor-reported data shows callback adoption cuts abandonment by roughly one-third, and a large majority of callers prefer a callback over sitting on hold.
Here’s the priority order for your first week:
- Enable callback or virtual queue (impact: hours to set up, results visible within days) — biggest lever, lowest lift.
- Simplify your IVR menu and announce estimated wait times (impact: 1 to 2 days) — poor IVR design is a proven abandonment driver.
- Patch near-term staffing gaps with overtime or shift swaps (impact: 1 week) — buys time while you fix forecasting.
Track abandon rate, Average Speed of Answer, and queue length hourly for the first 72 hours. If abandonment doesn’t move within a week, the problem is likely staffing, not technology.
Table of Contents
- How to Reduce Call Wait Times: Key Metrics You Need First
- Core Strategies to Reduce Hold Times and Call Abandonment
- Quick Wins vs. Long-Term Projects: A Prioritization Framework
- Keeping Wait Times Down Once You’ve Fixed Them
- A Contact Center Manager’s Take on Speed vs. Quality
- Where AI Voice Automation Fits the Playbook
- Sources
- FAQ
How to Reduce Call Wait Times: Key Metrics You Need First
You can’t manage what you don’t measure, and most contact centers track the wrong mix of numbers. Four metrics matter here: Average Speed of Answer (ASA) is total wait time across answered calls divided by the number of calls answered. Average Handle Time (AHT) covers talk time plus hold plus after-call work. Abandonment rate is abandoned calls divided by total offered calls, expressed as a percentage. Service level, usually expressed as 80/20, means 80 percent of calls answered within 20 seconds.
| Metric | Formula | Typical Target |
|---|---|---|
| ASA | Total wait time ÷ calls answered | 20 seconds |
| Abandonment rate | Abandoned calls ÷ offered calls | Under 5% |
| Service level | % answered within X seconds | 80/20 (varies by industry) |
| AHT | Talk + hold + after-call work | Varies by call complexity |
The 80/20 benchmark isn’t universal — a healthcare scheduling line and a technical support queue have very different acceptable wait windows. Some operations relax that target intentionally when longer, more thorough calls raise first call resolution. Pick a benchmark that fits your call complexity, not one copied from a competitor’s dashboard.
Core Strategies to Reduce Hold Times and Call Abandonment
Every tactic below trades something for speed. Knowing the trade-off up front saves you from a rollout that backfires.
Intelligent routing and IVR simplification send callers to the right skill group on the first try instead of bouncing them through transfers. Cutting menu layers from five to two typically shortens the path to an agent and reduces the confusion that drives early hangups. Implementation runs 1 to 3 weeks depending on your phone system’s flexibility. The pitfall: over-engineering the menu tree so callers still get lost, just with fewer options.
Callback and virtual queuing let callers keep their place in line without staying on the phone. Beyond the abandonment reduction already cited, this tactic pairs especially well with accurate forecasting, since you know roughly when call-back volume will hit. Pros: high caller satisfaction, minimal infrastructure change. Cons: requires clear expectation-setting, or callers get frustrated waiting for a callback that comes late.
Self-service and voice bots absorb routine questions before they ever reach a live queue. An AWS case study found a significant reduction in call handling time after routing a sizable share of calls to a self-service virtual agent. Order status, appointment confirmations, and password resets are strong candidates. Complex complaints and anything requiring empathy should stay with live agents.

Workforce management fixes the root cause instead of the symptom. Forecasting error is one of the leading causes of avoidable hold time, and intraday adherence tracking lets supervisors catch staffing gaps mid-shift instead of discovering them in next week’s report. Quick-staffing tactics like on-call agent pools help bridge unexpected spikes while longer forecasting fixes take shape.
AHT reduction and agent enablement shorten every call so the queue moves faster overall. Knowledge bases surfaced directly in the agent’s screen can cut search time. CRM integrations pull customer history automatically. ANI-based identity matching reduces verification questions that add cost and minutes per call.
Pro Tip: If your service level target is squeezing agents into rushing calls, try widening the answer window slightly for complex queues. Several contact center leaders report that a small relaxation in ASA targets improves first call resolution enough to reduce repeat calls, which lowers total queue volume more than the faster-but-shallower calls did.
Quick Wins vs. Long-Term Projects: A Prioritization Framework
Not every fix belongs on this week’s to-do list. Sort interventions by impact versus effort before you commit budget or staff time.
High impact, low effort (do first): callback/virtual queue, IVR menu trimming, wait-time announcements.
High impact, higher effort (plan next): workforce management overhaul, forecasting model rebuild, intelligent skills-based routing.
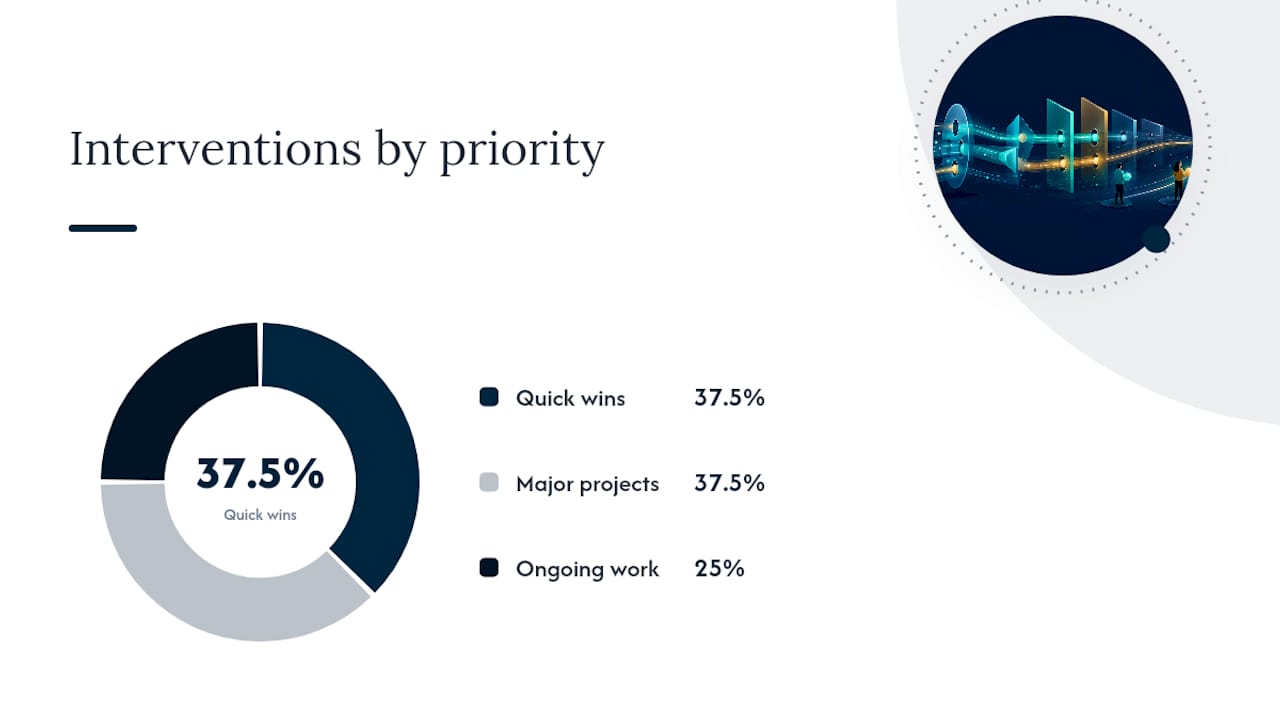
Medium impact, ongoing: self-service and voice bot expansion, agent knowledge base rollout.
A rough implementation timeline:
- Week 1: Callback option, IVR simplification, staffing patch.
- Weeks 2 to 6: Forecasting model correction, intraday adherence tracking, agent knowledge base.
- Months 2 to 4: Skills-based routing overhaul, self-service and voice bot deployment for high-volume call types.
Sequencing matters. Fixing routing logic before your forecasting is accurate just routes callers efficiently into an understaffed queue.
Keeping Wait Times Down Once You’ve Fixed Them
A dashboard your supervisors actually check daily beats a perfect one nobody opens. Track ASA, queue length by skill, AHT, abandonment rate, and forecast accuracy every day, with intraday check-ins during peak hours.
Build a short daily routine: a 10-minute morning huddle reviewing overnight queue data, a midday staffing check against forecast, and an escalation rule for when abandonment crosses your threshold mid-shift.
Pro Tip: Never optimize ASA in isolation. Watch first call resolution alongside it every week. A dropping ASA paired with rising repeat-call volume means agents are rushing, not resolving.
A Contact Center Manager’s Take on Speed vs. Quality
The instinct to chase a faster ASA number is understandable, and it’s also how quality quietly erodes. I’ve watched teams hit their 80/20 target while first call resolution slid for months, because nobody was watching both numbers together.
Run pilots, not full rollouts. Test a callback option on one queue for two weeks, measure abandonment and FCR side by side, then decide. The data tells you faster than a gut feeling ever will.
Where AI Voice Automation Fits the Playbook
Everything above works. It also takes people, training time, and ongoing management attention. For teams that need queue relief without building a full workforce management program, AI voice agents cover the ground between quick wins and long-term infrastructure.
42voice deploys AI voice agents that handle inbound calls, appointment booking, lead qualification, and after-hours coverage around the clock, in more than 9 languages. Every call the agent resolves is one that never enters your queue, which directly lowers ASA and abandonment without adding headcount. Setup typically takes 3 to 5 days, connecting to your existing calendar and CRM through CRM phone integration.
A smart pilot scope: route after-hours calls and routine booking requests to the AI agent for two weeks, then compare abandonment and ASA against your baseline. Most managers see the fastest gains on high-volume, low-complexity call types first. Visit the customer support agent solutions page to see which use case fits your queue, or start a pilot through the client setup form.
Sources
- Cut Call Abandonment Rates: Data‑Driven Strategies for 2026 | Xima Software
- Average Call Wait Time in Call Centers
- Reduce call hold time and improve customer experience with self-service virtual agents using Amazon Connect and Amazon Lex | AWS
- How to Reduce Call Center Wait Times: 7 Proven Strategies
FAQ
What is the 80/20 rule in call centers?
The 80/20 rule means answering 80 percent of calls within 20 seconds. It’s a common service level benchmark, though the right window varies by industry and call complexity.
What is the 10-5-3 rule in customer service?
Definitions of this rule vary across sources and aren’t standardized in industry benchmarking, so treat any specific numbers you find with caution rather than as a fixed standard.
Why are call wait times so long?
Long wait times usually come from understaffing relative to call volume, forecasting errors, confusing IVR menus, and calls that take too long to resolve on the first attempt.
How do I speed up call hold time?
Enable a callback or virtual queue option, simplify your IVR, fix short-term staffing gaps, and route routine calls to self-service or an AI voice agent so live agents handle only the calls that need them.
Can AI voice agents actually reduce call wait times?
Yes. AI agents that handle bookings, FAQs, and after-hours calls remove volume from the live queue entirely, which lowers both ASA and abandonment without requiring new hires.